The Expense insights template is an indispensable wireframe tailored for businesses to delve into their cost structure and financial performance. This concise yet comprehensive template encapsulates crucial metrics that empower decision-makers, particularly CFOs and financial executives. to strategize effectively and optimize operations.
Screen 1: Executive Summary
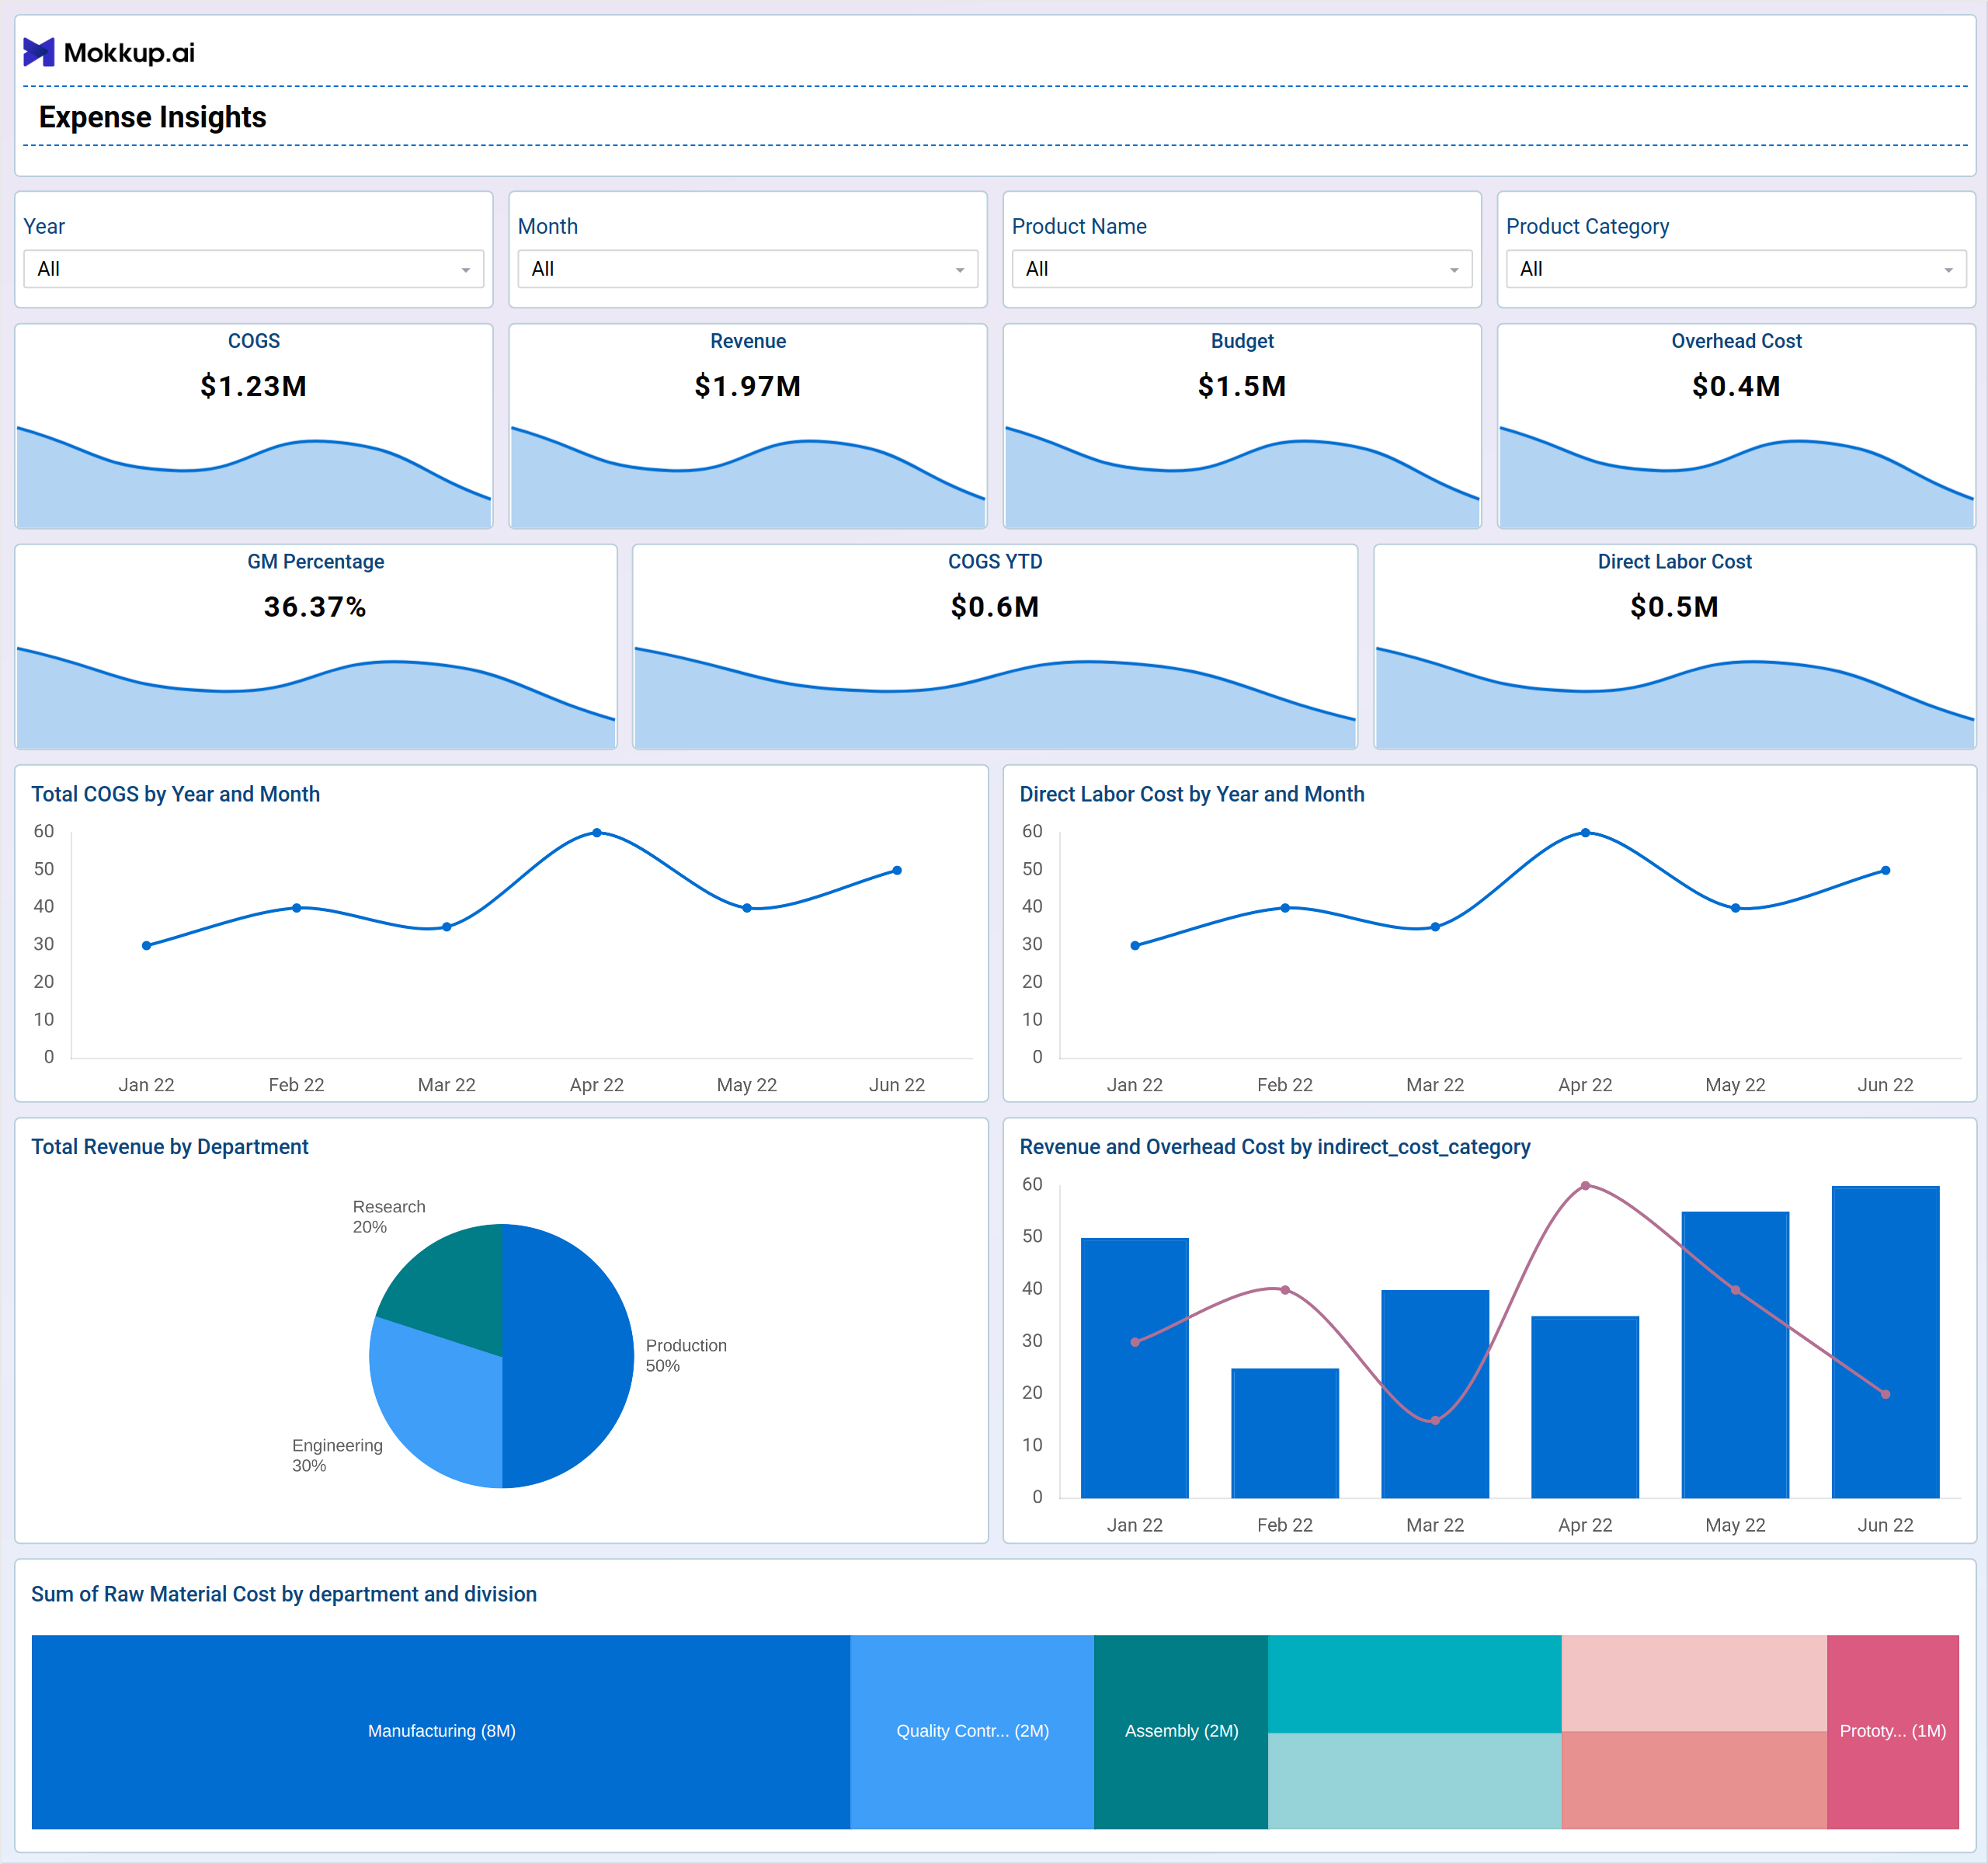
Understanding key financial metrics is crucial for effective business management. COGS, or Cost of Goods Sold, reveals direct production expenses, while Overhead Cost encompasses indirect expenditures. Direct Labor Cost denotes wages for production personnel. COGS YTD offers a year-to-date snapshot of production expenses. GM Percentage indicates profitability before other costs.
Additionally, tracking raw material costs by department and division, as well as revenue and overhead costs, facilitates granular financial analysis for improved decision-making.
Key Terms to consider:
- COGS: COGS, or Cost of Goods Sold, represents the direct costs associated with producing goods or services sold by a company.
- Overhead Cost: Overhead Cost includes all indirect expenses not directly tied to production, such as rent, utilities, and administrative expenses.
- Direct Labor Cost: Direct Labor Cost refers to the wages and benefits paid to employees directly involved in producing goods or delivering services.
- COGS YTD: COGS YTD indicates the cumulative Cost of Goods Sold Year-to-Date.
- GM Percentage: GM Percentage, or Gross Margin Percentage, represents the proportion of revenue that exceeds the COGS, indicating profitability before other expenses.
- Sum of Raw Material Cost by Department and Division: This metric calculates the total cost of raw materials used by each department and division within the company.
- Revenue and Overhead Cost by Department and Division: This metric breaks down revenue and overhead costs, providing insights into financial performance at the departmental and divisional levels.
Screen 2: Overhead Cost
Understanding overhead costs is essential for financial management. Overhead Cost encompasses indirect expenses like administrative costs, while Previous Year Overhead Cost compares current expenses to the prior year. Overhead Budget denotes allocated funds for indirect expenses, and Overhead Cost % w.r.t Revenue calculates overhead proportionately. Tracking Overhead Cost and Budget by Year and Month offers insights over time, while Overhead Cost by Product Name provides product-specific analysis.
Key Terms to consider:
- Overhead Cost: Encompasses indirect expenses not tied to production, such as administrative costs.
- Previous Year Overhead Cost: Compares current overhead expenses to those of the previous year.
- Overhead Budget: Represents the allocated funds for indirect expenses within a specified period.
- Overhead Cost % w.r.t Revenue: Calculates the proportion of overhead costs relative to revenue.
- Overhead Cost and Overhead Budget by Year and Month: Tracks overhead expenses and budgetary allocations over time.
- Overhead Cost by Product Name: Provides insight into indirect expenses associated with specific products.
- Sum of Overhead Cost by Indirect Cost Category: Aggregates overhead expenses across different categories.
- Sales variance %: Measures the percentage difference between actual and expected sales revenue.
Dashboard Template Insights
- This template is a crucial tool for businesses aiming to comprehend and enhance their cost structures and financial performance.
- Tailored specifically for CFOs and financial executives, it presents a succinct yet thorough overview of essential metrics vital for strategic decision-making.
- Metrics such as COGS, Overhead Cost, Direct Labor Cost, and GM Percentage are explored, providing executives with insights into production expenses, overheads, and profitability.
- Additionally, the template allows for detailed analysis by monitoring raw material costs, revenue, and overhead costs across various departments and divisions.
- Understanding these metrics empowers informed decision-making and operational optimization, ultimately fostering business success.
Conclusion
Expense Analysis template gives CFOs and financial leaders key data for strategic decision-making and cost minimization. Cost of Goods Sold, Direct Labour Cost, Manufacturing Cost Per Unit, and others explain the cost structure. Businesses may boost financial efficiency and competitiveness with these insights, ensuring long-term success.