What is an HR Salary Dashboard?
An HR Salary Dashboard is a centralized reporting view that consolidates salary data, employee compensation insights, and workforce payment metrics in one location. HR teams use this dashboard to monitor payroll trends, track salary distribution, and identify gaps in compensation structures. It provides a visual breakdown of key metrics, including the total number of employees, gross salary paid, net salary paid, deductions, failed payments, and appraisal averages.
An HR salary dashboard template enables HR teams to standardize reporting and enhance decision-making. It is designed to support salary reviews, budgeting cycles, and workforce planning conversations with accurate and real-time data. This type of dashboard is also essential for organizations that want to improve transparency and build a compensation analytics dashboard that scales with business growth.
How to Create an HR Salary Dashboard
You don’t need to build your report from scratch—just start with a ready-to-use dashboard template from Mokkup. Add in your data and export it however you like. Here’s how to do it:
1. Create or Log in to Your Mokkup Account
Start by signing up on Mokkup.ai using your email. If you already have an account, just log in, and you’ll be good to go.
2. Choose and Customize Your Dashboard Template
Find the HR salary dashboard template in the Templates section. Use the drag-and-drop editor to adjust KPIs, edit filters, or add elements based on your data.
3. Export to Your BI Tool
Once your dashboard wireframe is ready, use the BI Tool Export feature to send it directly to Power BI or Tableau for further analysis and enhancements. You can also download the dashboard as a PDF, PNG, or JPEG, embed it on a platform, or invite your team to collaborate.
Note: This is a Pro template. You’ll need a Pro subscription on Mokkup to use and customize this dashboard wireframe. Upgrade anytime to unlock full access.
HR Salary Dashboard Example
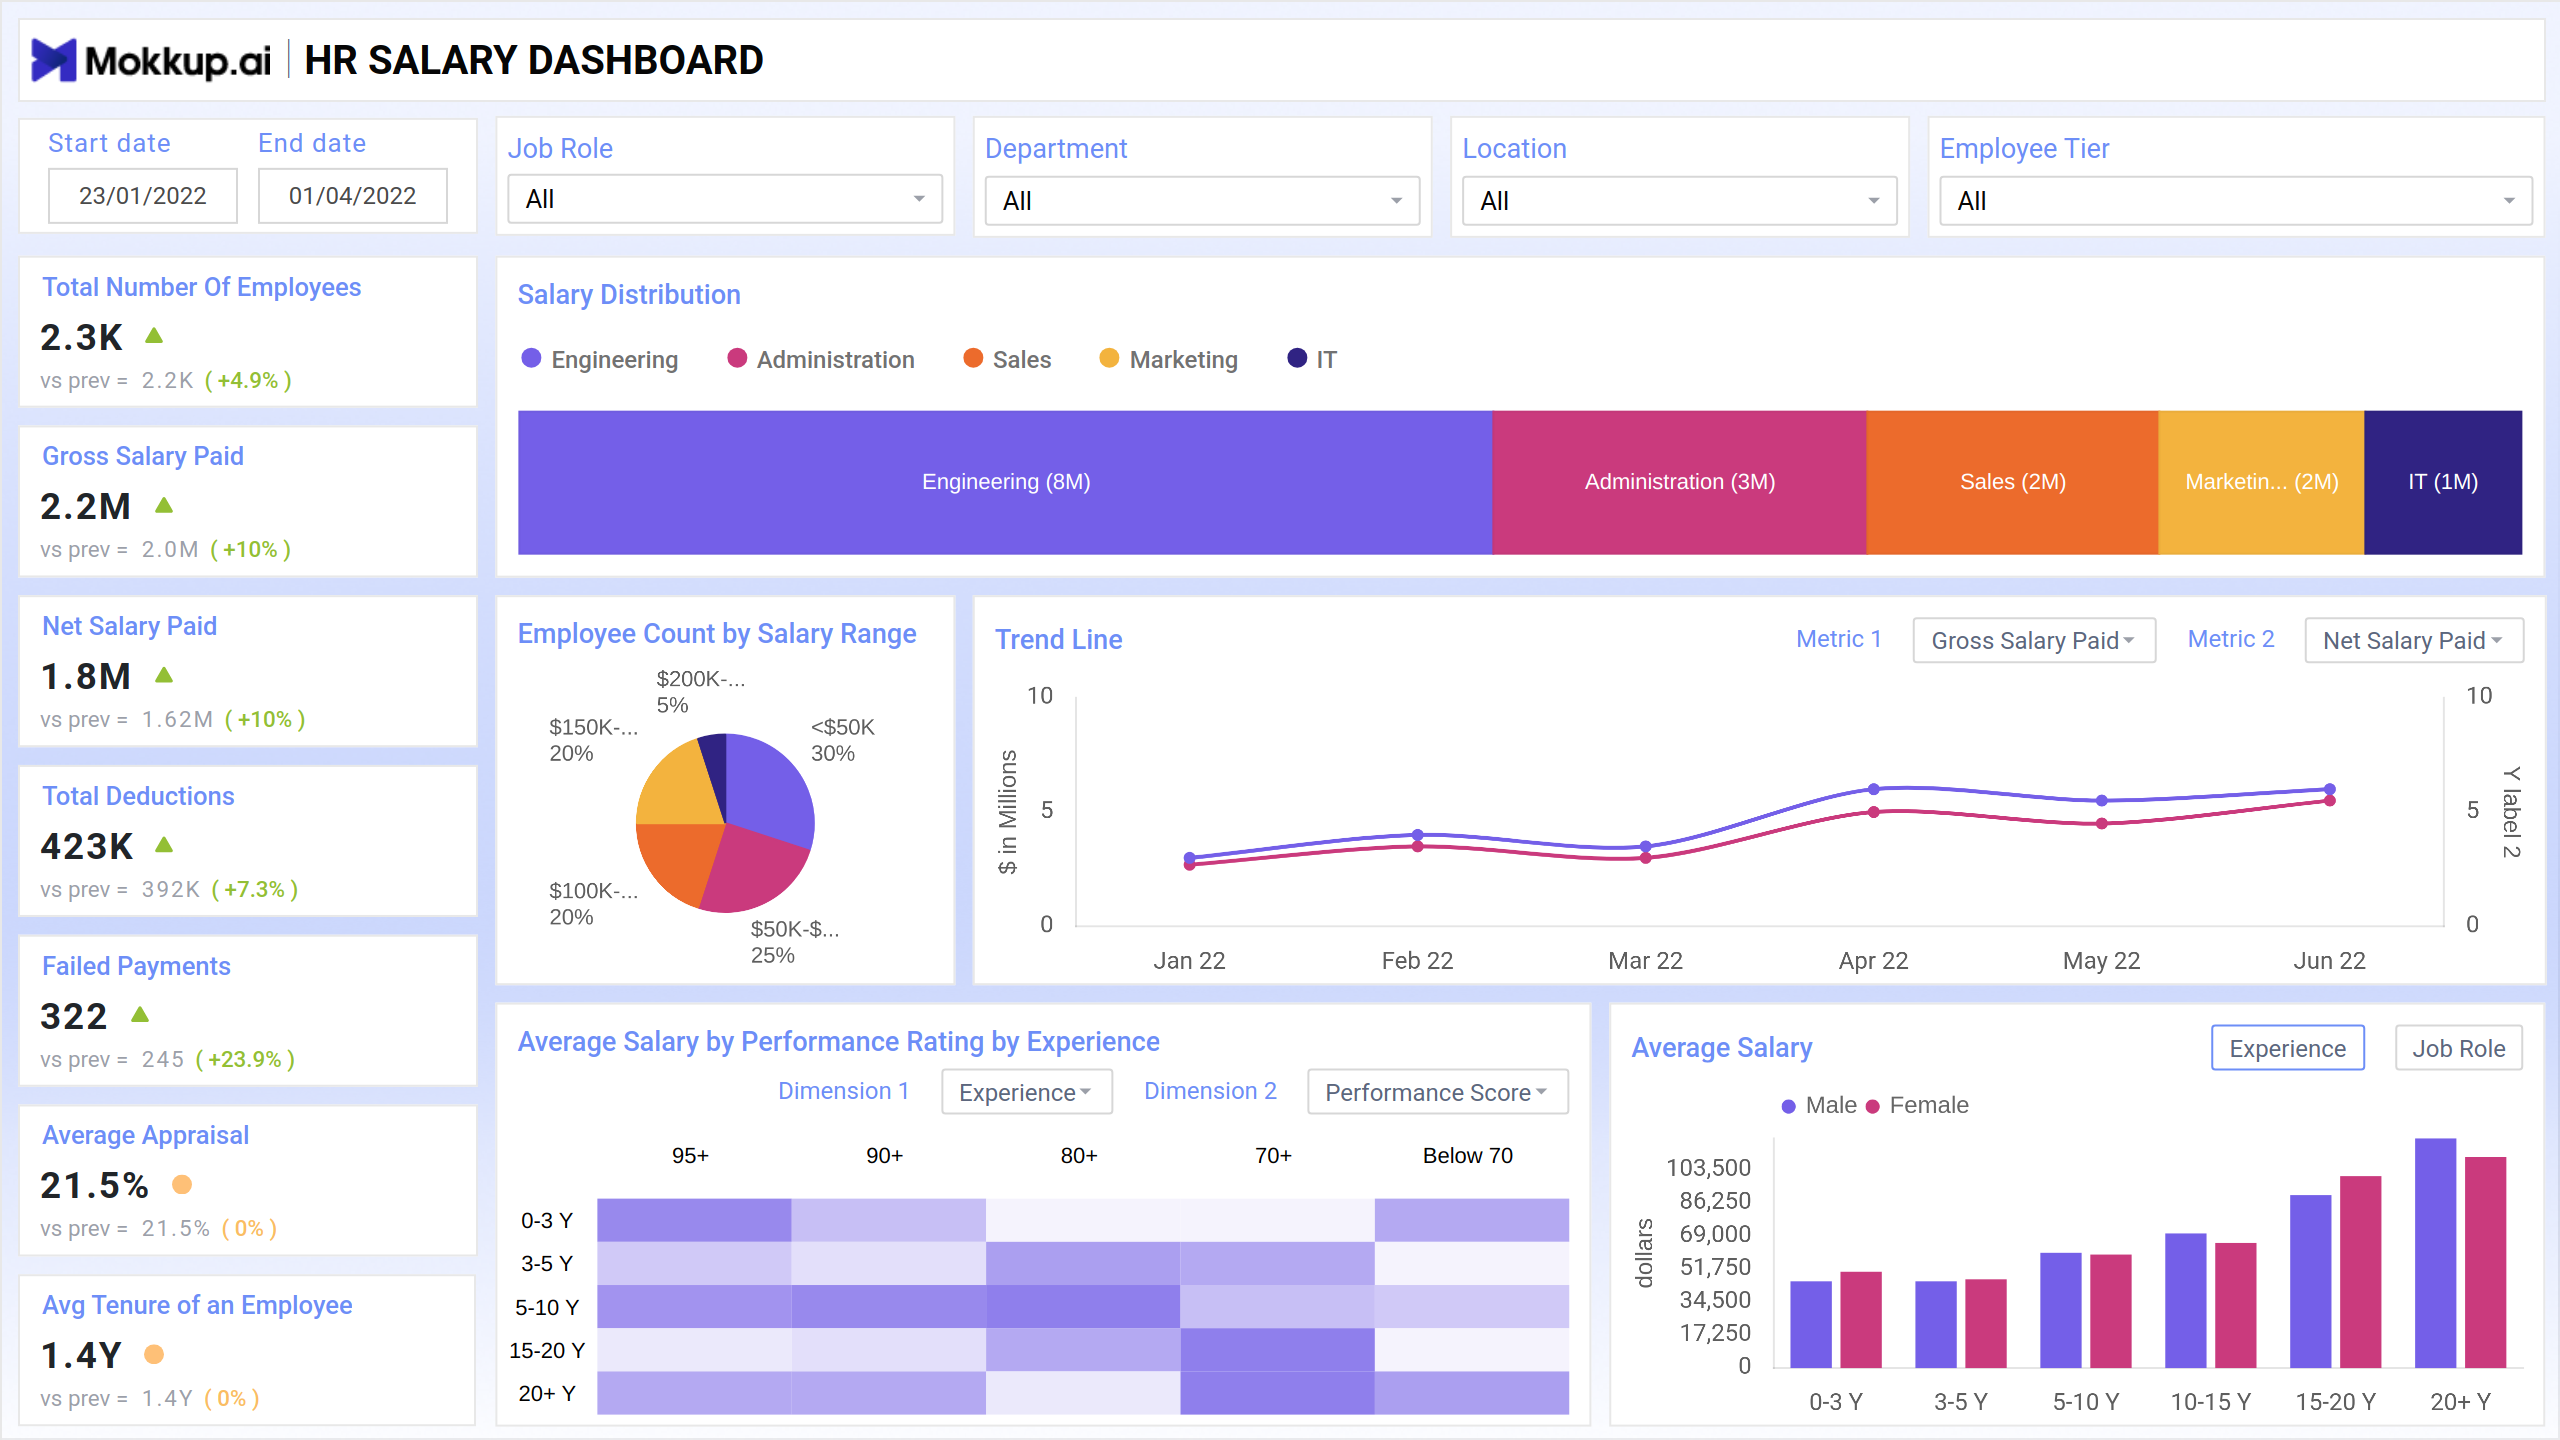
A typical HR employee salary dashboard visualizes compensation data using charts that simplify comparisons across departments, job roles, employee tiers, and salary bands. In the example shown above, the dashboard displays key salary metrics through components such as bar charts, pie charts, heatmaps, and trend lines.
The salary distribution bar clearly illustrates how compensation is allocated across various functions, including Engineering, Administration, Sales, Marketing, and IT. A pie chart illustrates the employee count by salary range, allowing HR teams to understand the distribution of employees across different salary ranges. A trend line chart tracks gross and net salary paid over time, making it easier to monitor payroll fluctuations. The heatmap is used to display the average salary by performance rating and experience. At the same time, the bar chart compares the average wages of male and female employees across various experience levels. This example demonstrates how a dashboard for visualizing employee compensation metrics helps contextualize salary data and makes it actionable for HR teams.
How to Analyze Data in HR Salary Dashboards
Here is how you can analyze data from this dashboard:
- Monitor Salary Trends: Review the trend line chart for gross and net salary paid to identify increases, drops, or irregular payroll patterns over time.
- Compare Salary Distribution Across Departments: Use the salary distribution bar to detect how compensation is allocated across Engineering, Sales, Marketing, Administration, and IT.
- Review Salary Range Segmentation: Analyze the employee count by salary range to understand the distribution of employees across specific pay brackets.
- Track Deduction Patterns: Assess total deductions to ensure compliance with statutory rules and to spot inconsistencies in payroll processing.
- Identify Payroll Errors: Monitor failed payments to resolve processing issues and maintain employee satisfaction quickly.
- Evaluate Performance-Based Compensation: Utilize heatmaps to correlate performance ratings with salary levels and identify mismatches or biases in appraisal-linked salary increments.
- Assess Pay Equality Across Groups: Compare male and female salary bars across experience levels to ensure fairness and correct potential pay gaps.
Benefits of HR Salary Dashboards
- Unified View of Compensation Data: Consolidates payroll, appraisal, salary range, and headcount information into one dashboard for efficient analysis.
- Improved Salary Transparency: Enables HR teams to build trust and compliance through clear visibility into compensation structures.
- Reduction in Payroll Errors: By tracking failed payments and deduction patterns, HR teams can minimize payroll inaccuracies.
- Better Compensation Benchmarking: Supports benchmarking with HR analytics salary reports to align pay structures with industry standards.
- Real-Time Workforce Cost Insights: Provides leaders with immediate visibility into salary spending across departments and job roles.
- Stronger Budget Planning: Enhances salary forecasting and budget allocation with accurate visibility into gross and net salary trends.
- Identification of Pay Gaps: Highlights inconsistencies in salary distribution across experience levels, departments, and gender.
KPIs to Track in HR Salary Dashboards
- Total Number of Employees: Tracks workforce size and helps compare compensation distribution across headcount.
- Salary Distribution: Displays how salary budgets are allocated across various departments, including Engineering, Sales, and IT.
- Gross Salary Paid: Total salary paid before deductions; useful for payroll forecasting and budgeting.
- Net Salary Paid: The Amount employees receive after deductions; a key payroll accuracy indicator.
- Employee Count by Salary Range: This helps identify the number of employees who fall into specific salary brackets.
- Trend Line for Salary Metrics: Tracks gross and net salary patterns over time for payroll trend analysis.
- Total Deductions: Captures statutory and voluntary deductions to ensure compliance with relevant regulations.
- Failed Payments: Highlights errors or system issues affecting salary disbursement.
- Average Appraisal: Measures average performance-linked compensation changes across the workforce.
Frequently Asked Questions
1. What is an HR Salary Dashboard template?
It is a pre-designed framework for visualizing payroll and compensation data. It helps HR teams create consistent and accurate reports quickly.
2. Who uses an employee salary dashboard?
HR managers, payroll teams, finance leaders, and department heads use it to track employee compensation metrics.
3. What makes it the best HR dashboard for salary analysis?
Its ability to integrate payroll metrics, salary distribution insights, performance data, and deduction information in a single view.
4. Is this dashboard useful for compensation planning?
Yes. It acts as a compensation analytics dashboard that supports forecasting, budgeting, and restructuring decisions.