
What is a Personal Finance Performance Dashboard?
A Personal Finance Performance Dashboard is a digital tool designed to help individuals visualize and manage their income, expenses, and savings in one place. It consolidates all financial data — from salary and freelance income to bills and subscriptions — into a single, interactive view. By leveraging a personal finance analytics tool, users can monitor cash flow trends, identify overspending areas, and track financial goals over time. Unlike traditional spreadsheets, this personal financial metrics dashboard uses automated data visualization to show exactly how your money moves each month, empowering smarter budgeting and better savings decisions.
How to Create a Personal Finance Performance Dashboard
You don’t need to build your report from scratch—just start with a ready-to-use Personal Finance Performance dashboard template from Mokkup. Add in your data and export it however you like. Here’s how to do it:
1. Create or Log in to Your Mokkup Account
Start by signing up on Mokkup.ai using your email. If you already have an account, just log in, and you’ll be good to go.
2. Choose and Customize Your Dashboard Template
Find the Personal Finance Performance Dashboard template in the Templates section. Use the drag-and-drop editor to adjust KPIs, edit filters, or add elements based on your data.
3. Export to Your BI Tool
Once your dashboard wireframe is ready, use the BI Tool Export feature to send it directly to Power BI or Tableau for further analysis and enhancements. You can also download the dashboard as a PDF, PNG, or JPEG, embed it on a platform, or invite your team to collaborate.
Note: This is a Pro template. You’ll need a Pro subscription on Mokkup to use and customize this dashboard wireframe. Upgrade anytime to unlock full access.
Personal Finance Performance Dashboard Example
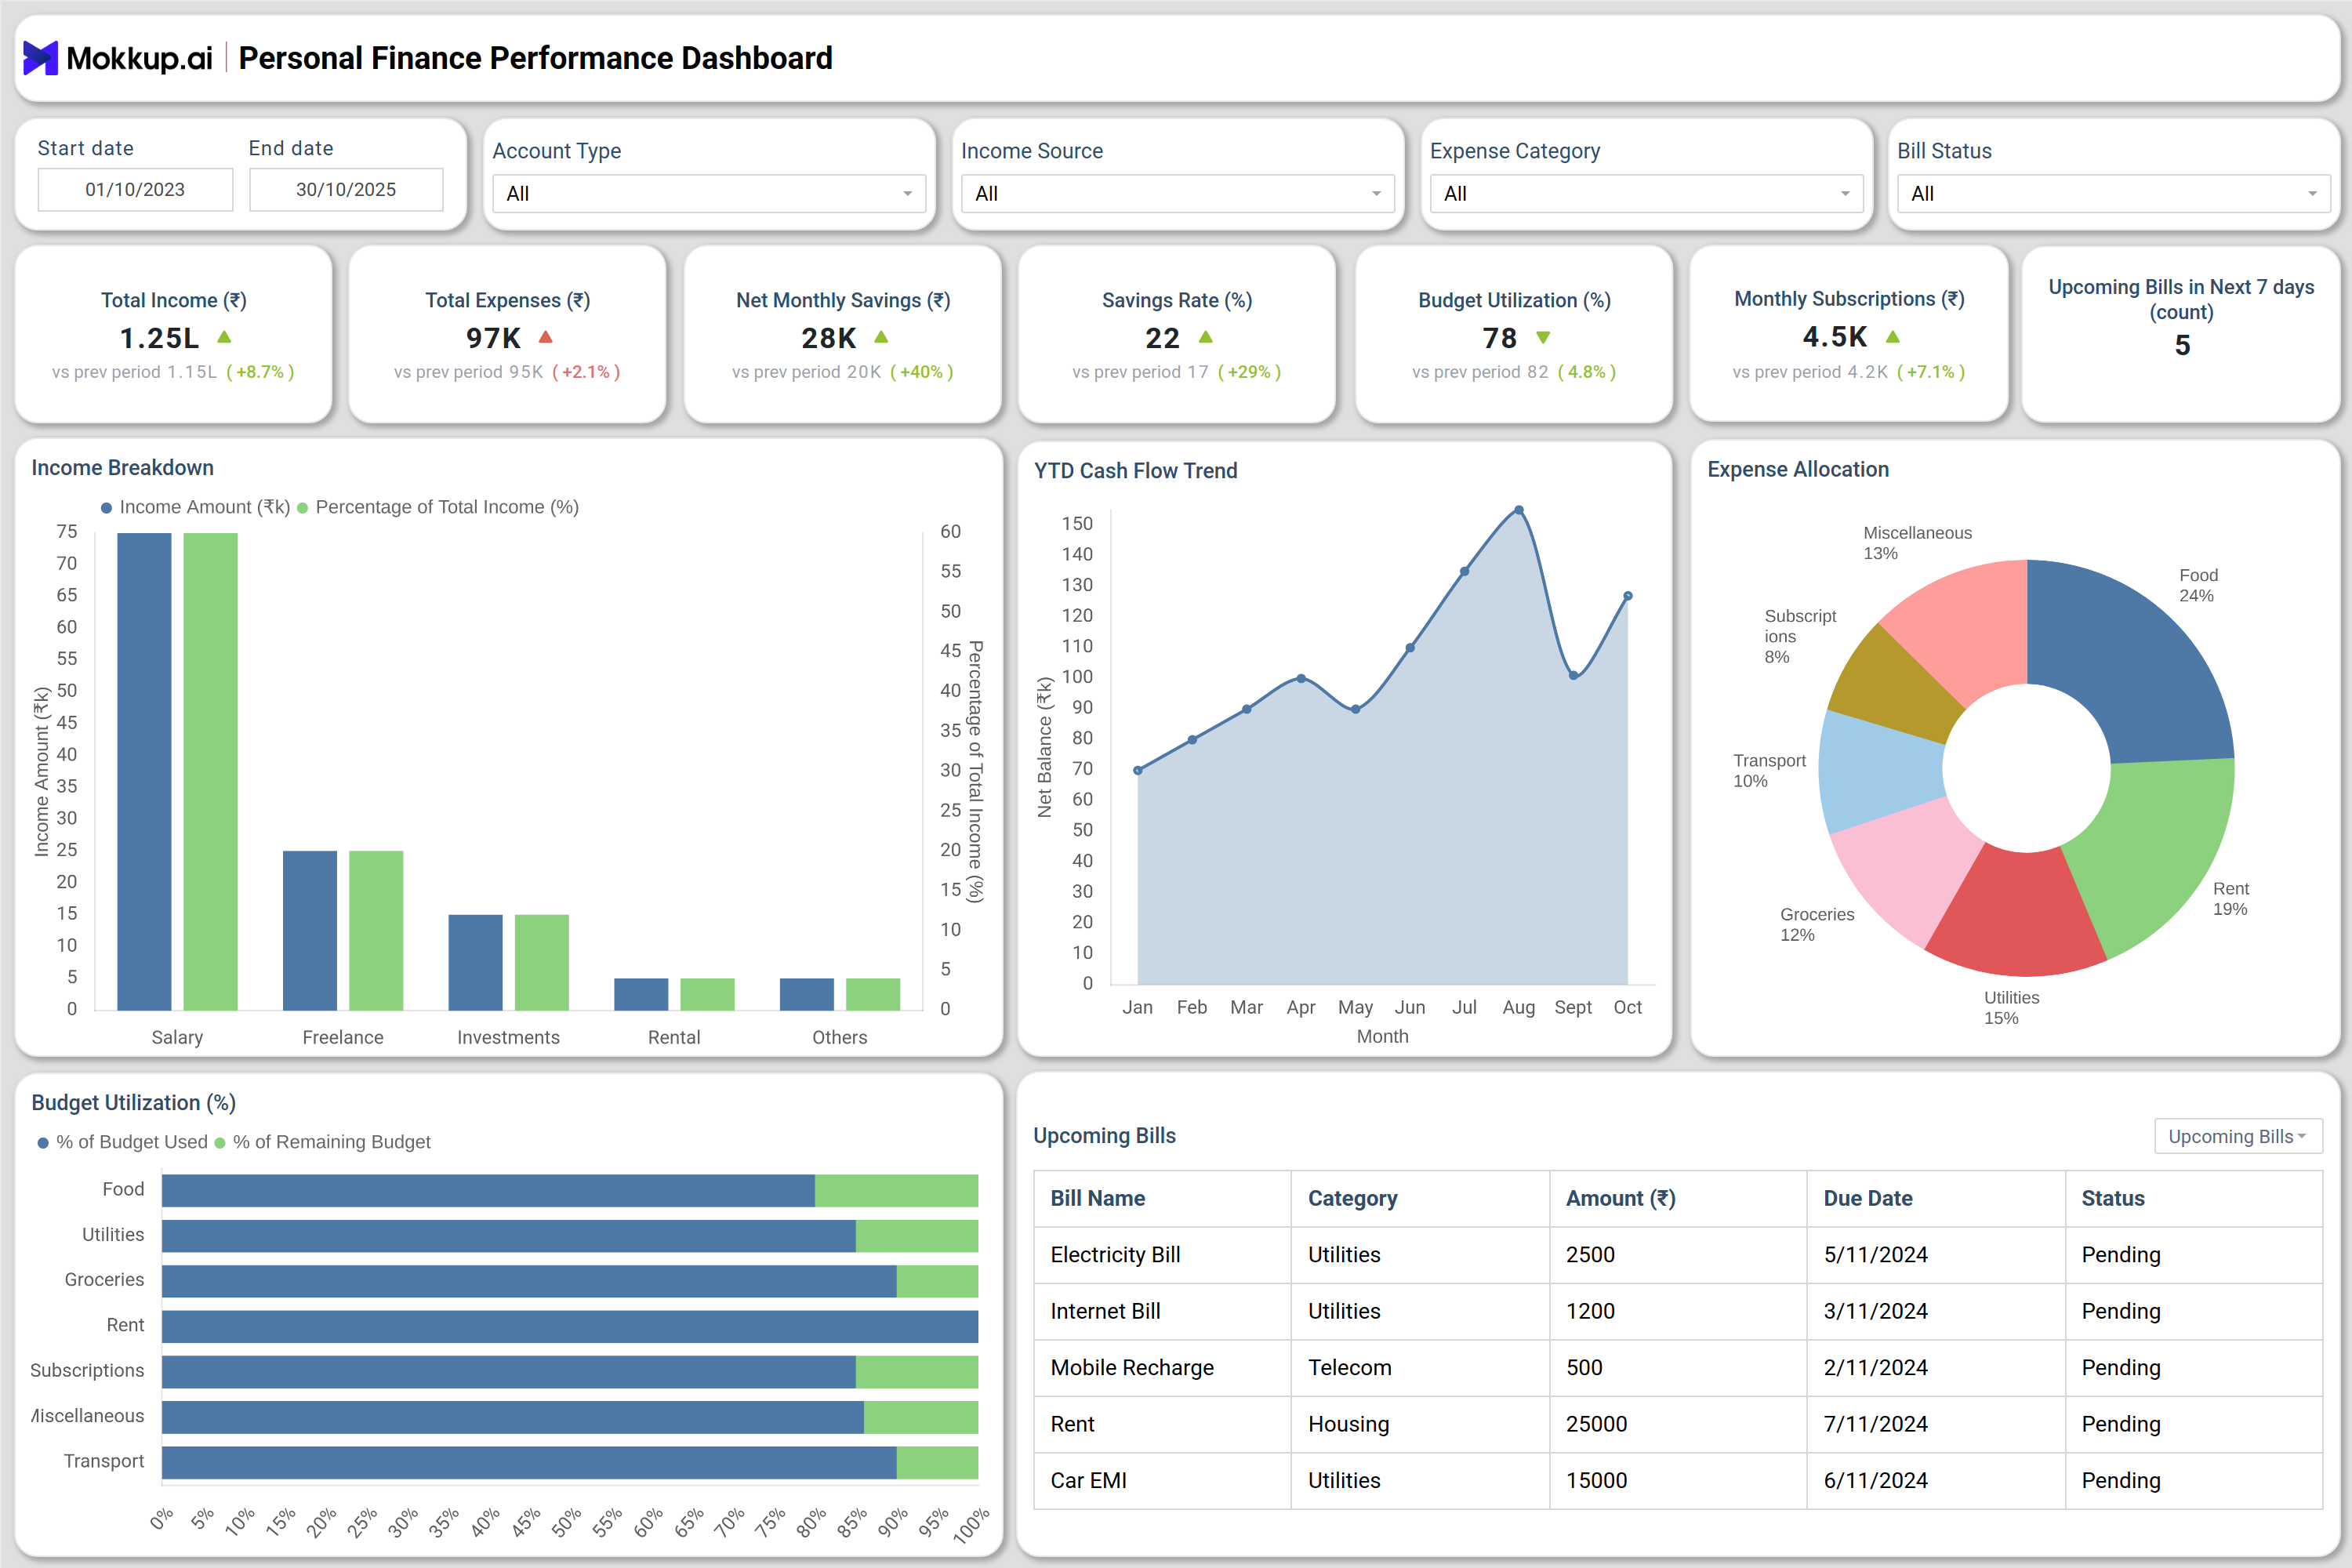
You can create your own Personal Finance Performance Dashboard to track income streams, expenses, and savings behavior seamlessly. In this example, the dashboard combines data from bank accounts, bills, and investments. It helps users measure budget utilization, identify recurring expenses such as subscriptions, and analyze cash flow trends across months. Through charts and metrics, the personal budget performance tracker displays how much you earn, spend, and save, highlighting categories like rent, food, utilities, and transport. Using this personal finance tracking dashboard, individuals gain a holistic view of their financial health, helping them make informed decisions about spending control and goal planning.
How to Analyze Data in Personal Finance Performance Dashboard
Here is how you can analyze data in the Personal Finance Performance Dashboard:
- Monitor Total Income and Expense Trends: Track your earnings and monthly costs to understand cash inflows and outflows.
- Evaluate Net Savings: Compare your total income against total expenses to identify savings potential each month.
- Check Savings Rate (%): Measure how effectively you convert income into savings — a key indicator of financial discipline.
- Analyze Budget Utilization: Determine which expense categories consume the largest share of your budget using visual breakdowns.
- Review Expense Categories: Use the expense allocation donut chart to assess where spending is concentrated — such as food, rent, or utilities.
- Track Recurring Subscriptions: Monitor monthly subscription costs to reduce unnecessary recurring expenses.
- Visualize Cash Flow Trends: Follow the YTD cash flow line chart to see financial progress or warning signs over time.
- Manage Bills Efficiently: Review the bills table to ensure timely payments and prevent overdue penalties.
Benefits of Personal Finance Performance Dashboard
These are the benefits of using the Personal Finance Performance Dashboard:
- Centralized Financial Overview: Consolidates income, spending, and savings data into one finance performance monitoring dashboard.
- Improved Budget Awareness: The dashboard helps track where money is spent and how much remains in each budget category.
- Better Decision-Making: Enables smarter financial planning through clear visualization of income vs. expense ratios.
- Goal-Oriented Savings: The dashboard supports better savings planning by showing progress toward monthly or yearly goals.
- Automated Financial Insights: Reduces manual calculations by automatically analyzing patterns and highlighting areas for improvement.
- Expense Control: By identifying overspending categories, users can adjust habits and improve long-term financial stability.
- Bill Payment Tracking: Prevents missed payments by displaying upcoming bills with due dates and amounts.
- Financial Accountability: Encourages responsible management by clearly reflecting lifestyle costs and saving habits.
KPIs to Track in Personal Finance Performance Dashboard
- Total Income (₹): Total earnings from salary, freelance, investments, and other sources during a given period.
- Total Expenses (₹): Overall spending across all categories — including rent, utilities, food, and subscriptions.
- Net Monthly Savings (₹): Income minus expenses — showing how much you save each month.
- Savings Rate (%): Ratio of savings to total income; helps assess how effectively you manage money.
- Budget Utilization (%): The percentage of your monthly budget already spent — ideal for monitoring overspending.
- Monthly Subscriptions (₹): Regular recurring payments that impact monthly cash flow.
- Upcoming Bills (Count): Number of pending bills, helping prioritize upcoming expenses.
Frequently Asked Questions
1. What is a Personal Finance Performance Dashboard used for?
It’s used to monitor income, expenses, savings, and financial performance in one place, making it easier to manage personal budgets effectively.
2. How does a personal finance tracking dashboard help improve savings?
By analyzing spending patterns and highlighting areas where expenses can be reduced, it helps increase savings over time.
3. Can I use this dashboard for multiple income sources?
Yes. The personal finance analytics tool supports salary, freelance, rental, and investment income tracking.
4. Is it suitable for freelancers or self-employed users?
Absolutely. Freelancers can use this personal financial metrics dashboard to track irregular income and monitor expenses for better financial planning.
5. How often should I review my dashboard data?
Monthly reviews are ideal to maintain financial discipline and ensure budget utilization aligns with goals.