What is a Student Performance Dashboard?
A Student Performance Dashboard is a centralized reporting tool designed for schools, teachers, and administrators to monitor academic progress in real time. It tracks metrics such as attendance, quiz scores, assignment completion, participation rates, and student risk levels. It consolidates multiple performance metrics, such as average quiz scores, assignment completion rates, and academic progression, into a single view. By using a dashboard for tracking student performance, schools and universities can quickly identify strengths, weaknesses, and trends across individual students or entire classes.
How to Create a Student Performance Dashboard
You don’t need to build your report from scratch—just start with a ready-to-use Student Performance dashboard template from Mokkup. Add in your data and export it however you like. Here’s how to do it:
1. Create or Log in to Your Mokkup Account
Start by signing up on Mokkup.ai using your email. If you already have an account, just log in, and you’ll be good to go.
2. Choose and Customize Your Dashboard Template
Find the Student Performance Dashboard template in the Templates section. Use the drag-and-drop editor to adjust KPIs, edit filters, or add elements based on your data.
3. Export to Your BI Tool
Once your dashboard wireframe is ready, use the BI Tool Export feature to send it directly to Power BI or Tableau for further analysis and enhancements. You can also download the dashboard as a PDF, PNG, or JPEG, embed it on a platform, or invite your team to collaborate.
Note: This is a Pro template. You’ll need a Pro subscription on Mokkup to use and customize this dashboard wireframe. Upgrade anytime to unlock full access.
Student Performance Dashboard Example
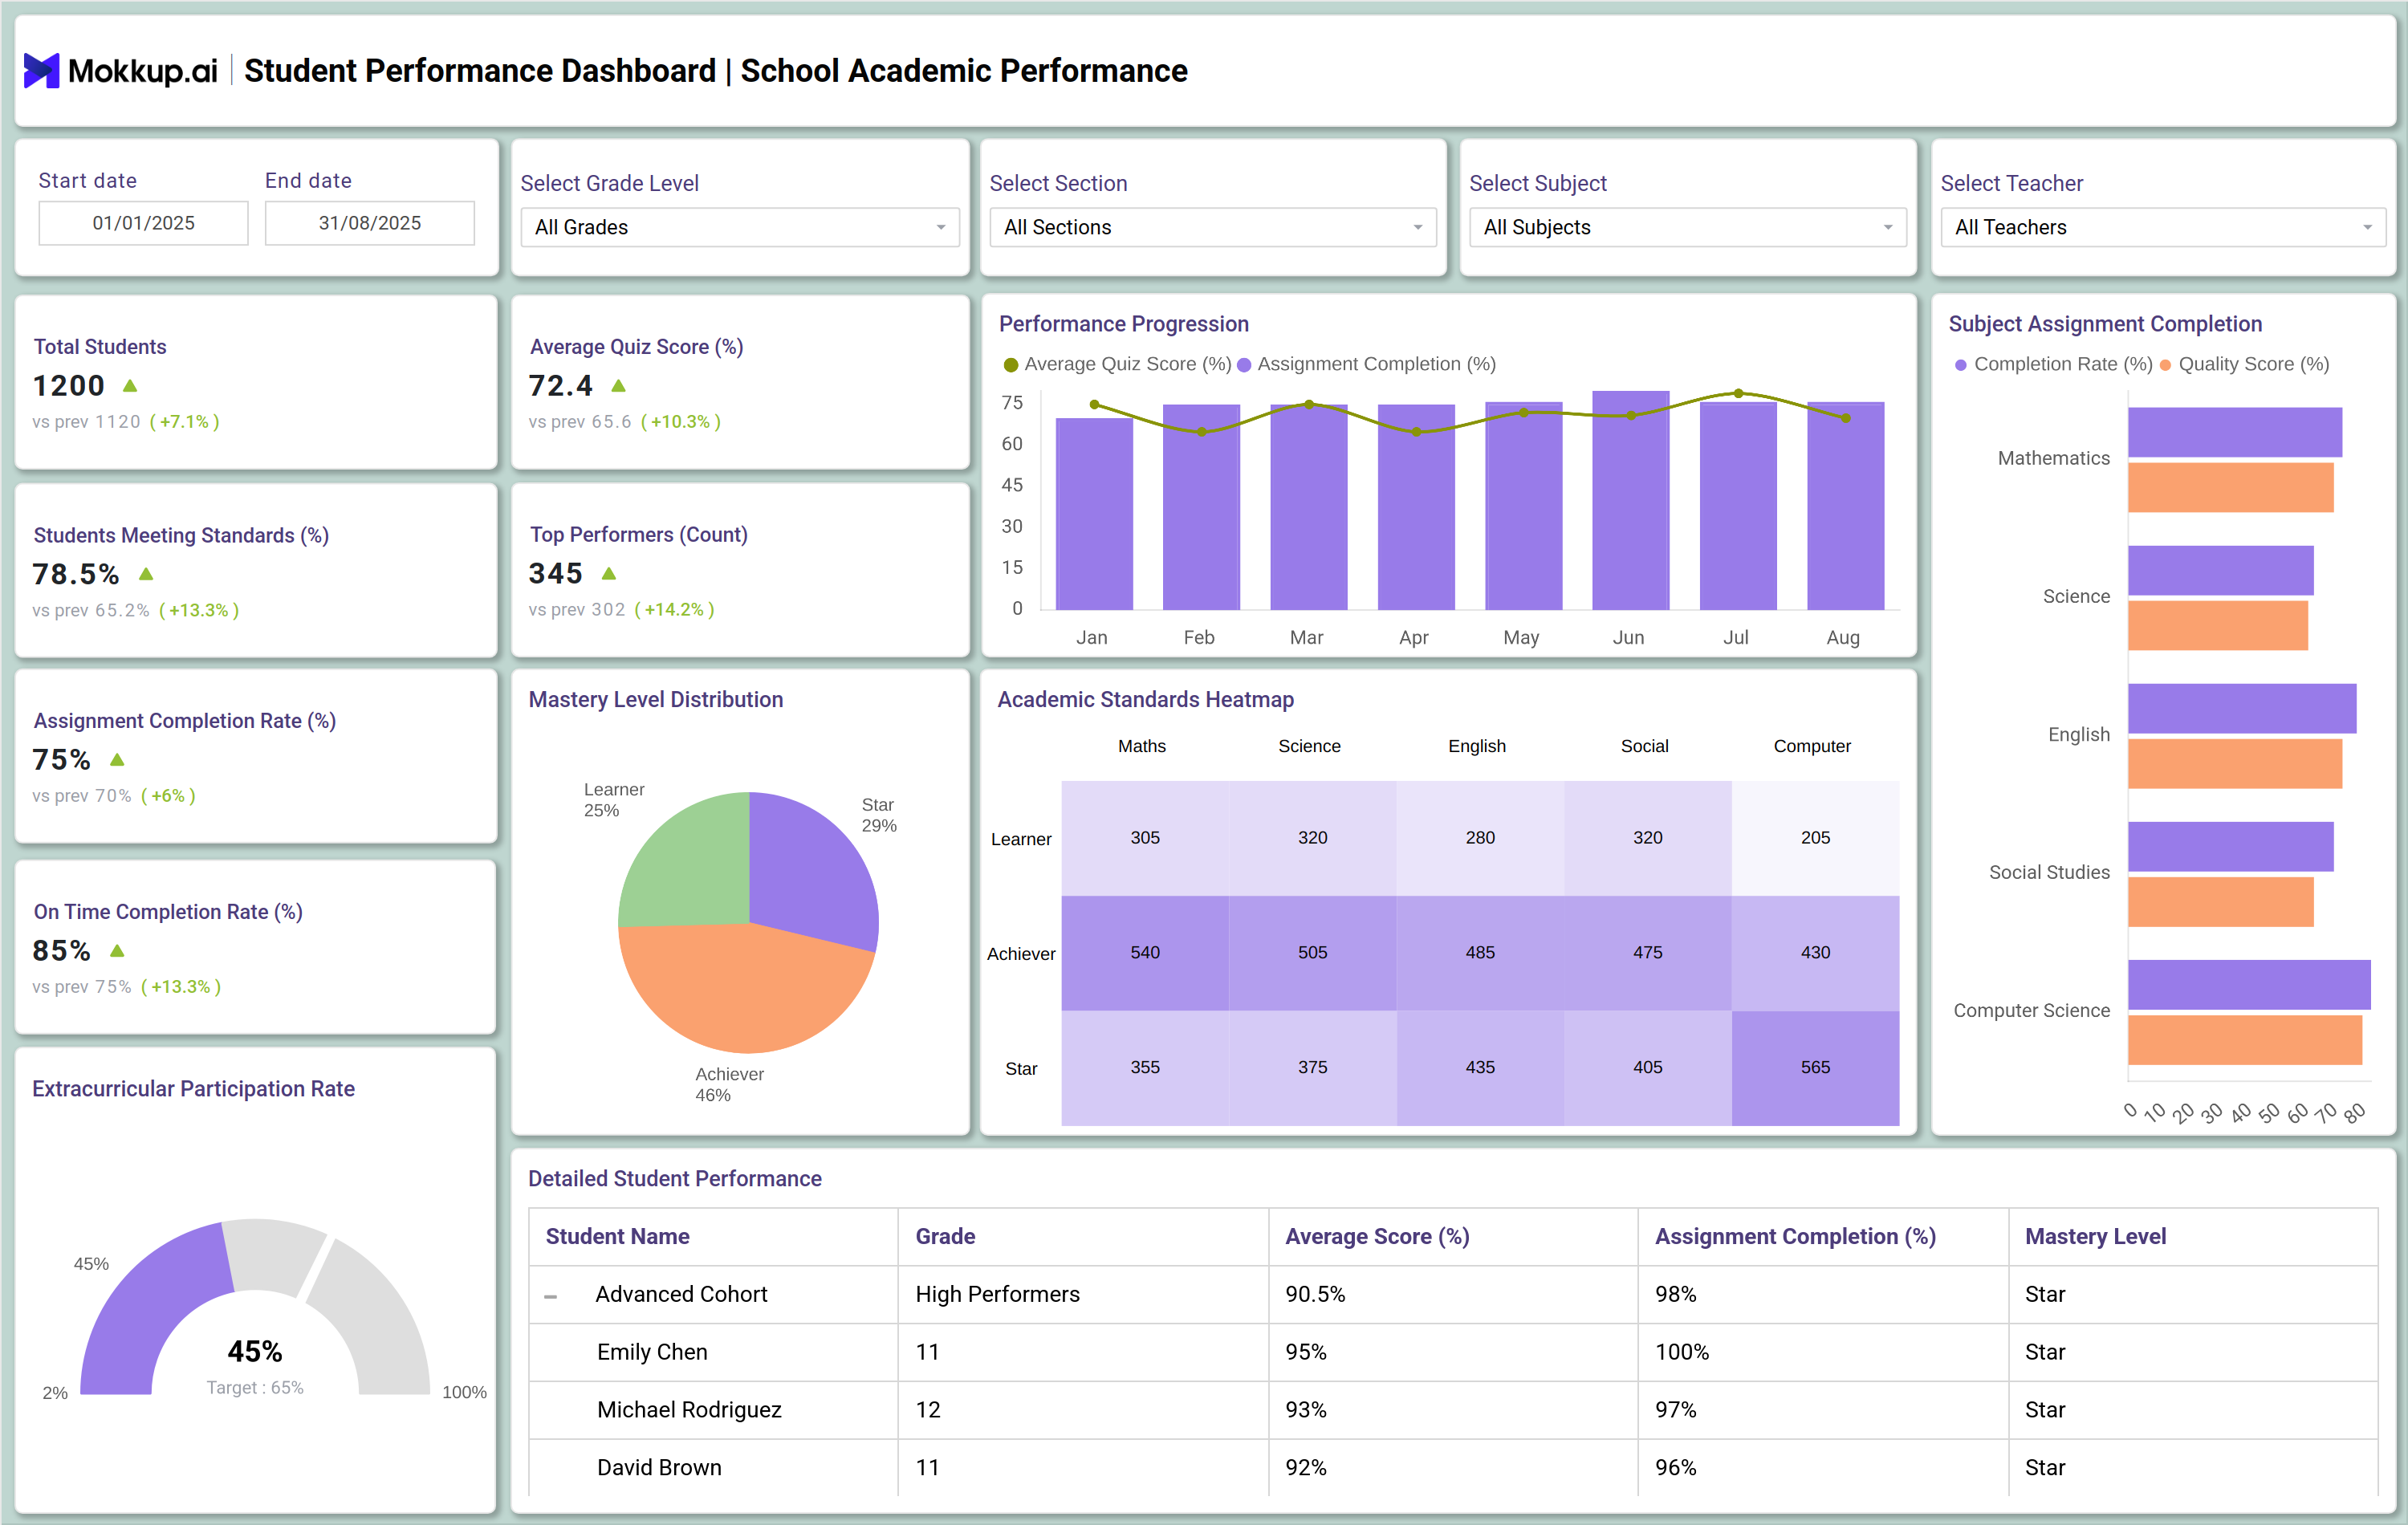
A typical student progress tracking dashboard might display a heatmap showing academic performance against national or institutional standards. Teachers can see which students are excelling and which need extra support. For example, one panel might track the average quiz score per subject, while another shows performance progression over time. Such a student performance tracking system enables teachers and administrators to move beyond intuition and make data-driven interventions.
How to Analyze Data in Student Performance Dashboards
To get the most value from a KPI dashboard for student performance, educators should follow structured analysis steps:
- Identify performance trends – Track whether students are improving, declining, or plateauing over time.
- Compare groups or cohorts – Evaluate performance differences between classes, grade levels, or demographic groups.
- Spot high-performing and at-risk students – Quickly filter the dashboard to highlight students excelling or falling behind.
- Drill down into subject-level data – Use the education data visualization dashboard to see topic-specific performance, such as algebra vs. geometry.
- Track assignment and quiz completion – Measure engagement through on-time submissions and participation rates.
- Benchmark against academic standards – Use heatmaps to compare results with set academic or institutional benchmarks.
Benefits of Student Performance Dashboards
Implementing the best student performance dashboard software provides several benefits:
- Centralized performance monitoring – All student data is available in one interactive platform.
- Data-driven teaching strategies – Teachers can do data-driven lesson planning based on student progress and engagement metrics.
- Early identification of learning gaps – Struggling students are flagged before their performance declines significantly.
- Improved student accountability – Students can track their progress and stay engaged with learning goals.
- Enhanced communication with parents – Dashboards can be shared with parents to provide transparent progress reports.
- Efficient resource allocation – Schools can identify where additional tutoring, mentoring, or curriculum changes are needed.
KPIs to Track in Student Performance Dashboards
Key performance indicators to measure in an academic performance tracking and reporting dashboard include:
- Attendance Percentage (%) → Tracks classroom presence and online participation.
- Average Quiz Score (%) → Evaluates academic understanding and mastery.
- Assignment Completion Rate (%) → Measures student responsibility and consistency.
- Students Requiring Intervention (Count) → Identifies learners who need additional support.
- Dropout Rate (%) → Monitors student retention against set targets.
- Engagement by Subject (%) → Highlights interest and performance in a specific area.
Frequently Asked Questions
1. Who should use a Student Performance Dashboard?
School administrators, teachers, academic coordinators, and district leaders who need real-time insights into student and classroom outcomes.
2. Can a student performance dashboard track individual and group progress?
Yes. A student performance tracking system can provide both student-level and class-level insights.
3. How is an online student performance dashboard different from traditional reports?
Traditional reports are static and retrospective. Dashboards provide real-time, interactive data visualization that allows for immediate action.