Traffic Management Report dashboard template provides a streamlined and interactive platform for monitoring traffic flow, congestion levels, and incident reports. With clear visualizations and real-time updates, it enables better decision-making and resource allocation to optimize traffic conditions. Ideal for city planners and traffic authorities, this template supports efficient urban mobility and transportation planning.
Overview of Violations and User Profiles
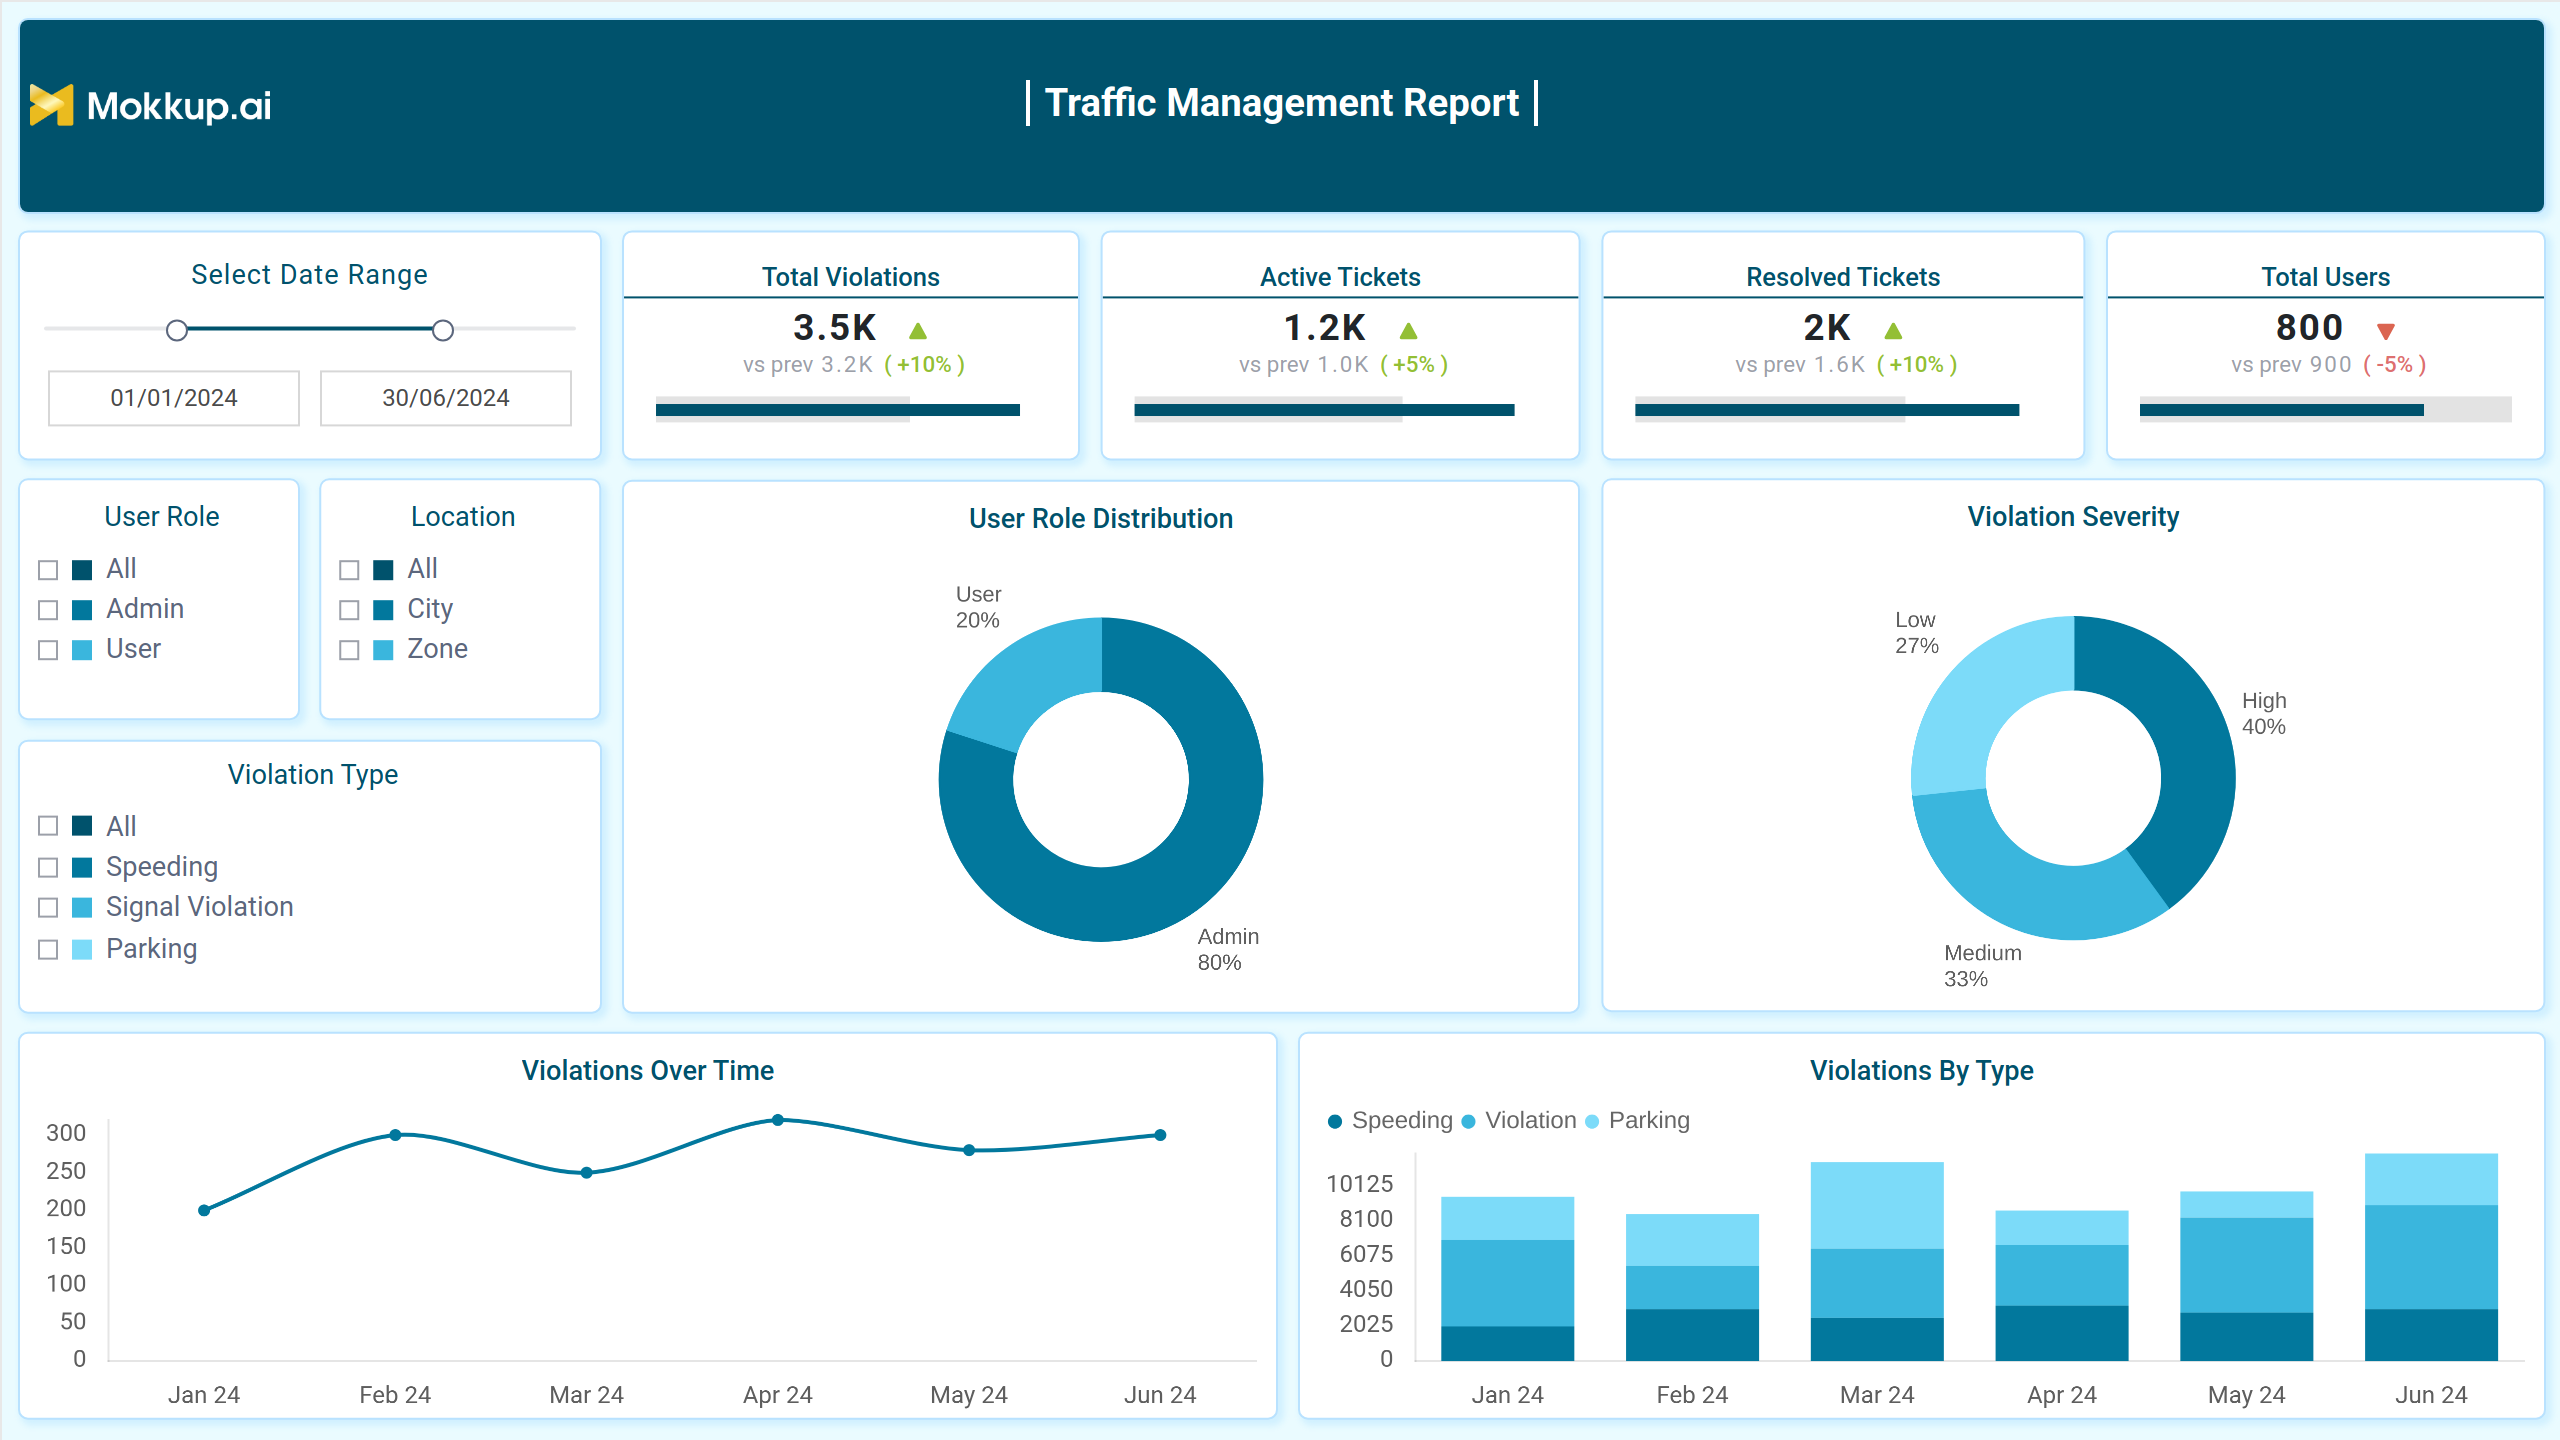
This screen offers a comprehensive view of activities and performance trends, highlighting patterns and distributions across various categories. With its visual insights and detailed metrics, it supports effective tracking and analysis for better decision-making and improved management processes.
Key Terms to Know
- Total Violations: Displays the number of recorded activities compared to the previous period, with a percentage change for trend analysis.
- Active Tickets: Shows the count of ongoing or unresolved cases, providing insights into current workload.
- Resolved Tickets: Indicates the number of completed actions, reflecting efficiency in issue resolution.
- Total Users: Tracks the number of participants involved, offering a view of engagement levels.
- User Role Distribution: Illustrates the proportion of different roles, helping to understand role-specific participation.
- Violation Severity: Categorizes occurrences by intensity, aiding in identifying critical areas.
- Violations Over Time: Visualizes activity trends across a timeline for pattern recognition.
- Violations By Type: Breaks down occurrences into categories, highlighting specific focus areas.
Violation Processing and Resolution
This screen provides an overview of resolution trends and outcomes, showcasing the number of unresolved cases, the time taken for actions, and success rates. Visual breakdowns and performance metrics highlight efficiency and identify bottlenecks, ensuring a streamlined process for addressing ongoing issues and improving resolution strategies.
Key Terms to Know
- Pending Resolutions: Displays the total number of cases awaiting resolution, highlighting the percentage change compared to the previous period.
- Average Resolution Time: Indicates the average time taken to resolve issues, with changes compared to prior data.
- Disputed Violations: Shows the number of challenges raised against cases, including percentage changes from before.
- Resolution Rate: Highlights the success rate of resolving cases, with a comparison to previous performance.
- Resolution Efficiency: Measures the overall effectiveness of resolution processes, displayed as a percentage against the target.
- Dispute Outcome: Visualizes the funnel stages of received, reviewed, accepted, and rejected disputes.
- Resolution Rate by Officer: Tracks the performance trends of officers over time in resolving cases.
- Violation Processing Time: Provides insights into the time taken to process various cases, shown across different time periods.
User Performance and Driving Record
This screen provides an overview of detailed user behavior and trends over a selected timeframe. It highlights performance patterns, comparative success metrics, and specific user records, offering actionable insights for effective analysis and decision-making while visually representing data with a clean and user-friendly layout.
Key Terms to Know
- Frequency Violators: Displays the count of individuals with repeated occurrences within the selected period, tracking trends over time.
- Average Points Deducted: Shows the average penalty points applied per instance, reflecting changes in severity or enforcement.
- Users with Zero Violations: Highlights the number of individuals maintaining a clean record within the timeframe.
- Dispute Success Rate: Indicates the percentage of successful dispute resolutions, showing effectiveness in addressing contested issues.
- Dispute Success by Type: Breaks down resolution outcomes by category, offering detailed insights into specific areas.
- Driving Record Summary: Lists users’ violation counts and associated penalties for a quick overview of individual histories.
- Average Points Deducted Over Time: Tracks trends in penalty severity over the analyzed timeframe.
- Violation by User Type: Compares infraction occurrences across different user categories, helping identify focus areas.
Notifications and Historical Data
This screen provides a comprehensive view of activity data, summarizing key actions, trends, and user behavior. It highlights various types of alerts, historical summaries, and patterns over time, offering insights to understand and manage operations effectively with detailed breakdowns and visual representations.
Key Terms to Know
- Total Notifications Sent: Displays the total number of notifications sent within the selected date range, along with the percentage change from the previous period.
- Payment Reminders: Indicates the number of reminders sent for payments, showing a comparison with the prior timeframe.
- New Violation Alerts: Represents the number of new alerts issued for violations, with a percentage difference compared to the previous period.
- History Downloads: Shows the count of downloaded historical records, including growth from the prior period.
- Alert Type Distribution: Visualizes the proportional distribution of different alert types using a bubble chart.
- Violation History Summary: Lists recent violations with corresponding dates, types, and points deducted.
- Notifications Over Time: Trends the volume of notifications sent across the specified timeline.
- Downloads by Month: Bar chart illustrating the number of downloads distributed across individual months.
Dashboard Template Insights
Here’s a quick overview of the Traffic Management Report dashboard template:
- Track key figures like notifications sent, payment reminders, and alerts to manage user interactions effectively.
- View detailed summaries of violation types and their impact on user points over time.
- Analyze trends in notifications and download activity alongside alert type distribution for better decision-making.
- Utilize date range selection and severity-level filters for a more tailored analysis experience.
Conclusion
This dashboard template provides a clear and organized way to monitor key metrics related to notifications, violations, and user activity. With interactive filters and trend analysis, it simplifies traffic management, offering actionable insights to improve decision-making and streamline communication across different areas of focus.